Connect the data to the decision.
Digital transformation only matters when an engineer can find the right signal faster. PLEC connects production, quality, and maintanence data into systems people can actually use.
Technology alone does not fix production loss. Culture does.
Many plants replace paper logs with dashboards that go unused. Tracking downtime is only the start: without waste awareness and team engagement, the same bottlenecks can persist shift after shift. PLEC brings real-time shop-floor data together with active continuous improvement.
The visual evidence behind the capability.
The right visual data makes a technical conversation faster: see the environment, understand the constraint, and decide what to investigate next.

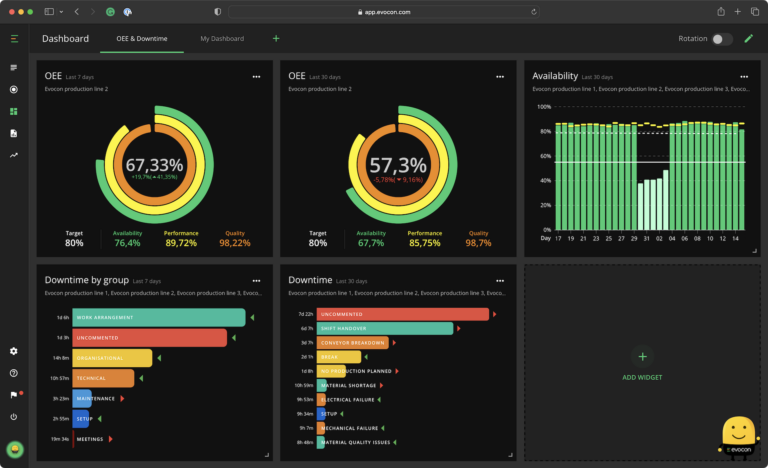
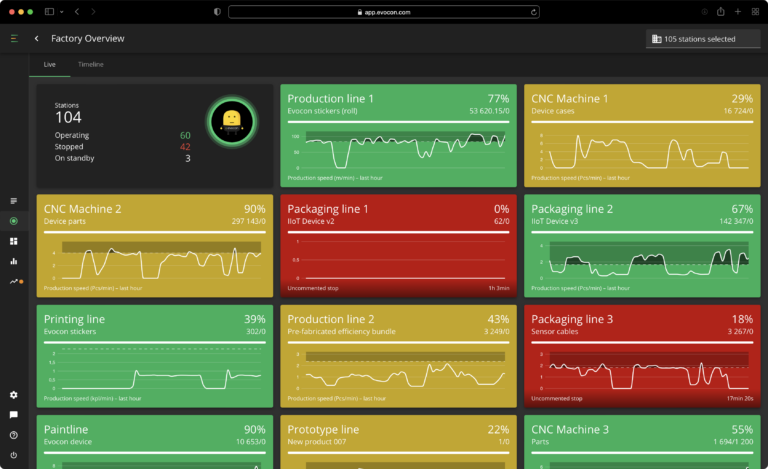
Data-driven hardware. Waste-aware culture.
Pair reliable machine data with simple, repeatable team habits so production signals lead to action.
Automated data capture with Evocon OEE
- Reduce manual shift logging and estimated stop reasons.
- Track availability, performance, and quality from connected machines.
- Give operators visual tools to register downtime and keep the line status clear.
A culture of total waste elimination
- Help teams identify the eight lean wastes, including defects, waiting, motion, and overproduction.
- Make OEE useful to operators and shift leads—not only a management report.
- Use short daily standups and tiered meetings to act on live production insights.
How Evocon OEE supports daily decisions.
Real-time visual management
Show live line status so teams can respond to micro-stops and emerging issues.
Automated stop-reason analysis
Group downtime causes to help teams investigate root causes instead of symptoms.
Production and shift analytics
Give plant leaders clear views across shifts, orders, and production lines.
Practical hardware setup
Connect to suitable existing machinery with a setup planned to limit disruption and IT overhead.
Turn common production losses into operational gains.
Downtime and waiting
Use timely line signals to investigate micro-stops and setup delays before they disrupt output.
Defects and rework
Track quality trends so teams can respond when process drift starts to affect good output.
Speed loss and overprocessing
Compare ideal cycle times with actual production to understand where capacity is being lost.
Unutilized talent
Give operators a clear way to record stop reasons and contribute improvement ideas.
Move from reactive firefighting to continuous improvement.
Potential OEE improvement
A directional range from the supplied campaign copy; actual outcomes depend on the starting point and implementation.
Downtime data
Automate stop capture where machine connectivity and the configured setup support it, reducing reliance on paper logs.
Improvement rhythm
Use shared production signals to focus team reviews on the next practical action.
OEE and business results vary by site, baseline, machine connectivity, implementation, and team adoption. The 15–25% range is indicative, not a guarantee.
See where the line is losing time.
Use a few shop-floor assumptions to separate availability, performance, and quality losses before deciding what to improve next.
OEE is calculated as availability × performance × quality using a standard production model.
Production assumptions
Put the improvement case on one page.
Start with the investment, then test how much production value an OEE improvement could recover across your machines.
The model uses operating cost and OEE uplift to estimate recovered value. It is a planning signal, not a financial forecast.
ROI assumptions
Turn scattered floor signals into a daily decision system.
A multi-line operation had machine signals, downtime notes, and production reviews living in separate places. The digitalization work focused on one trusted flow from the operator’s event to the engineer’s improvement decision.
Bring us in before the expensive part.
Whether you have a failing design, a line that is not holding its takt, or a data problem hiding behind spreadsheets, we can start with a focused technical review.
Scope a review